Output files
TumorQuantAI writes one result directory per slide and aggregates only completed slides into cohort matrices.
Main directory structure
results/
├── START_HERE.html
├── tumorquantai_report.json
├── workflow_metadata/
├── <sample>/
│   ├── cell_types/
│   │   ├── class_counts.csv
│   │   └── cell_type_coordinates.csv
│   ├── overlays/
│   │   └── celltypes_overview_and_zoom.png
│   ├── paper_figures/
│   │   ├── celltypes_paper_figure.png
│   │   ├── celltypes_paper_figure.pdf
│   │   ├── celltypes_paper_figure_legend.txt
│   │   ├── celltype_counts_barplot.png
│   │   └── celltype_counts_barplot.pdf
│   └── summary/
│       └── summary.json
└── aggregated_celltypes/
    ├── sample_aggregation_audit.csv
    ├── celltype_counts_by_sample.csv
    └── celltype_fractions_by_sample.csv
Additional files can appear when optional QuPath, JSON, QC-patch, collage, or cell-stage exports are enabled.
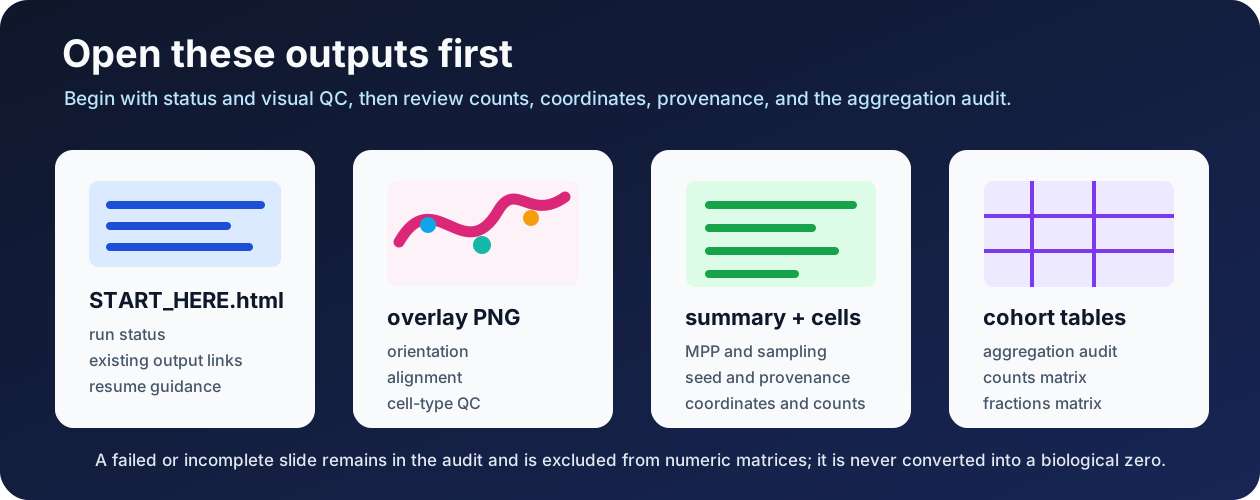
1. START_HERE.html
Open this file first. It summarizes:
- run completion state;
- included, failed, incomplete, excluded, and pending samples;
- selected preset and sampling percentage;
- links to outputs that exist;
- the local resume command when work remains.
# Regenerate the portable report when needed.
tumorquantai report /path/to/results
2. Per-slide overlay
<sample>/overlays/celltypes_overview_and_zoom.png
Review every overlay for:
- slide orientation;
- tissue-region selection;
- coordinate alignment;
- plausible cell-marker placement;
- artifacts, folds, blur, pen marks, or background;
- gross class-color errors.
A cohort matrix does not replace per-slide visual QC.
3. Per-slide summary
<sample>/summary/summary.json
The summary records completion and provenance fields such as:
- sample ID;
- source and target MPP;
- sampling percentage;
- random seed;
- tile counts;
- detected-cell counts;
- model revision and weight identity;
- container and software identity;
- input fingerprints;
- completion status.
Inspect it with:
# Display the formatted per-slide summary.
python -m json.tool \
  /path/to/results/case_001/summary/summary.json
4. Cell coordinates
<sample>/cell_types/cell_type_coordinates.csv
This table contains detected-cell identities, labels, centroids, bounding boxes, and related coordinate fields. Coordinates refer to the processed slide coordinate system recorded in the summary.
Do not join coordinate files to clinical data using public filenames or patient identifiers. Use controlled research sample IDs.
5. Per-slide class counts
<sample>/cell_types/class_counts.csv
This table contains counts in the processed tissue tiles for one completed slide.
For sampled runs:
- 1% counts describe the selected 1% of tissue tiles;
- 10% counts describe the selected 10% of tissue tiles;
- counts are not validated whole-slide totals;
- do not multiply counts by 100 or 10.
6. Aggregation audit
aggregated_celltypes/sample_aggregation_audit.csv
The audit is the first cohort file to review. It identifies samples that were:
- included;
- failed;
- incomplete;
- excluded;
- missing expected outputs.
A failed or incomplete sample is not a biological zero. It remains in the audit and is excluded from numeric matrices.
7. Count matrix
aggregated_celltypes/celltype_counts_by_sample.csv
Columns correspond to completed included samples. Values are raw HistoPLUS detections in processed tissue tiles.
Compare counts only when sampling, MPP, model identity, and other relevant settings are compatible.
8. Fraction matrix
aggregated_celltypes/celltype_fractions_by_sample.csv
Fractions are calculated within each completed sample from its processed-tile counts. They describe the composition of detected cells in the sampled tissue tiles.
Fractions do not correct for:
- tissue-area differences;
- slide quality;
- sampling uncertainty;
- model error;
- scanner or stain variation;
- failed or excluded samples.
Patch-mode paper figure and external legend
For tumorquantai --patches ... --paper-figures, review both:
<sample>/paper_figures/celltypes_paper_figure.png
<sample>/paper_figures/celltypes_paper_figure_legend.txt
The PNG/PDF figure uses a compact layout inspired by STTT 2026 Figure 6 and Figure 7: panel a contains every detected HistoPLUS cell type with its raw count and percentage of all detected cells; panel b is the scale-calibrated overview and selected ROI; panel c is the enlarged QC inset with the configured cell-type overlay and its own scale bar. The sample ID and interpretive prose are deliberately outside the artwork.
The adjacent text legend records panel descriptions, the source count table and
denominator, physical scale and ROI coordinates, pinned model identity, the
analyzed scope, and research-use limitations. Its portable path/layout version
is recorded in per-sample provenance. When the
completion summary records the current layout version, a missing or empty
legend prevents completion/resume reuse. At the worker layer, the layout version
is separate from the scientific processing signature, so direct reuse of the
same persistent worker output retains the legacy completion contract when its
summary has no layout version. Top-level tumorquantai runs under Nextflow,
whose task cache also keys staged worker code and configuration. Upgrading the
software may therefore invalidate PROCESS_SLIDE and re-enter HistoPLUS
inference. Before resuming, inspect a --dry-run plan for Nextflow -resume and
the original work directory. Preserve the exact software/work cache, or select
--cpu when cache reuse is uncertain. Use a new output directory or a deliberate
rerun when the redesigned figure is needed for a legacy result.
These are HistoPLUS cell-type predictions. They are not ER, PR, HER2, or Ki-67 scores, receptor-status calls, tumor classification, or proof of cell-level co-expression across separately stained patches. The layout reference is visual only and imports no external scientific or performance claim.
Colon CD3/CD8/CK20 whole-slide outputs
The package-native --inmunoscore route has a separate result contract from
the HistoPLUS files above. Start with:
<colon-result>/START_HERE.html
<colon-result>/tables/tumorquantai_immunoscore_values.csv
<colon-result>/tables/cohort_density_summary.csv
<colon-result>/tables/case_compartment_densities.csv
<colon-result>/tables/registration_qc.csv
<colon-result>/tables/paper_figure_manifest.csv
<colon-result>/PATHOLOGIST_REVIEW.html
The first CSV reports the four headline CD3/CD8 cells/mm² values in CK20
epithelial and stromal proxy compartments. The long CSV preserves numerator,
analysed-area denominator, actual MPP, mapped-positive fraction, and QC. Open
every cases/<case_alias>/registration_qc.png before interpreting either.
Missing marker sets and failures remain blank/unavailable, never zero.
Numerically available cases also receive a clearly named provisional pI0-pI4
analogue based on the mean of four percentiles against the automatic-QC-pass
cases in that run. It is a review-prioritization output, not consensus
Immunoscore. Each complete case has a 300-dpi case sheet and one review sheet
per CK20/CD3/CD8 WSI under paper_figures/; PNG, PDF, and external legends are
enumerated in the manifest.
PATHOLOGIST_REVIEW.html is an offline dashboard that preserves the algorithm
values and lets a reviewer export accept, flag, or exclude, structured
reasons, notes, reviewer code, and timestamp to CSV. The blank template and
codebook are also under tables/. Expert decisions never overwrite the
original prediction or automatic QC.
These measurements are a CK20-guided research proxy. The output deliberately leaves the consensus Immunoscore blank because no pathologist-validated tumour core/invasive margin or validated external reference distribution is present. See the full colon workflow and exact output schema.
Completed zero versus failure
A class count of zero is meaningful only when the slide completed and the class was absent from the processed tiles.
| Situation | Numeric matrix column? | Interpretation |
|---|---|---|
| Completed slide, one class count is zero | Yes | No detections for that class in processed tiles |
| Completed slide, total cells are zero | Yes, when valid completion is recorded | Completed biological/software zero requiring QC review |
| Failed slide | No | No valid numeric result |
| Incomplete slide | No | Resume or investigate |
| Excluded slide | No | Intentionally absent from the numeric cohort |
See Failed sample versus biological zero.
Check a run from the terminal
# Summarize the run state.
tumorquantai status /path/to/results

# List all required per-slide overlays.
find /path/to/results -type f \
  -path '*/overlays/celltypes_overview_and_zoom.png' \
  -print

# Display the aggregation audit.
column -s, -t \
  < /path/to/results/aggregated_celltypes/sample_aggregation_audit.csv
column is optional. Open the CSV directly when it is unavailable.
Preserve with every analysis
Keep:
START_HERE.htmlandtumorquantai_report.json;- every per-slide summary, overlay, paper figure, and external figure legend;
- cell coordinates and class counts used in analysis;
- aggregation audit and cohort matrices;
- input/sample-sheet provenance;
- source MPP provenance;
- software commit, model revision, and container identity;
- selected preset, sampling percentage, and seed.