Results and workflow gallery
These explanatory figures show how TumorQuantAI organizes a run. They are diagrams, not model-validation results or clinical examples.
Whole-slide workflow
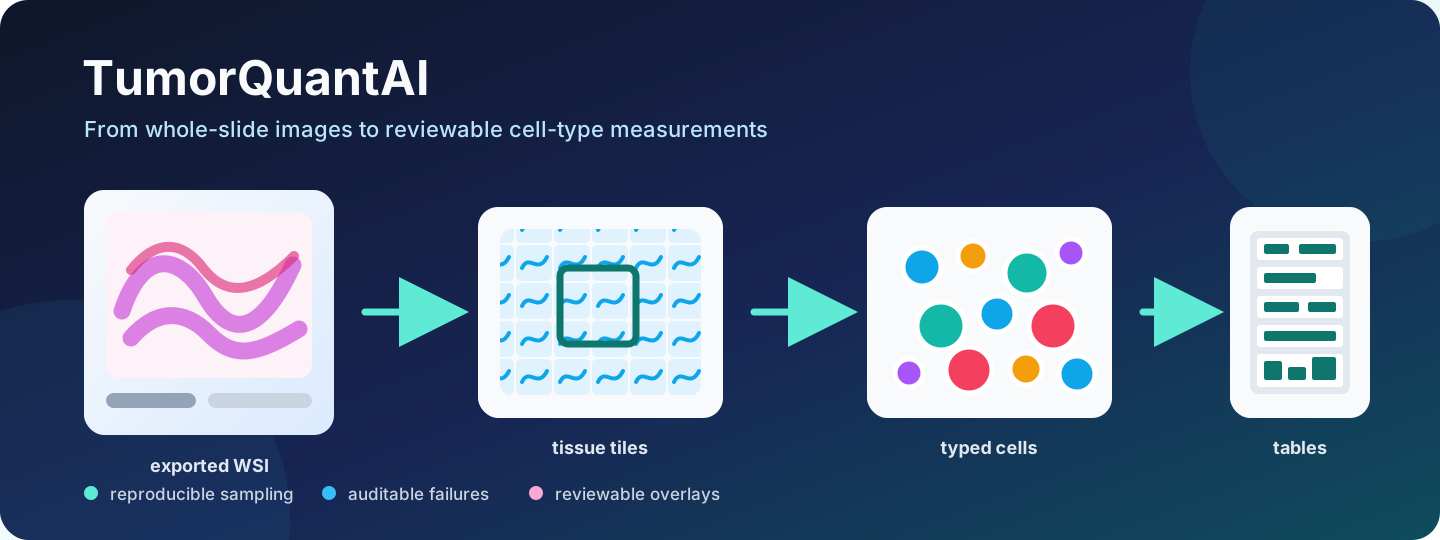
A primary H&E WSI is discovered with its physical scale, divided into tissue tiles, processed with HistoPLUS, and summarized as reviewable overlays, coordinates, per-slide counts, and cohort tables.
QuickStart Example 1
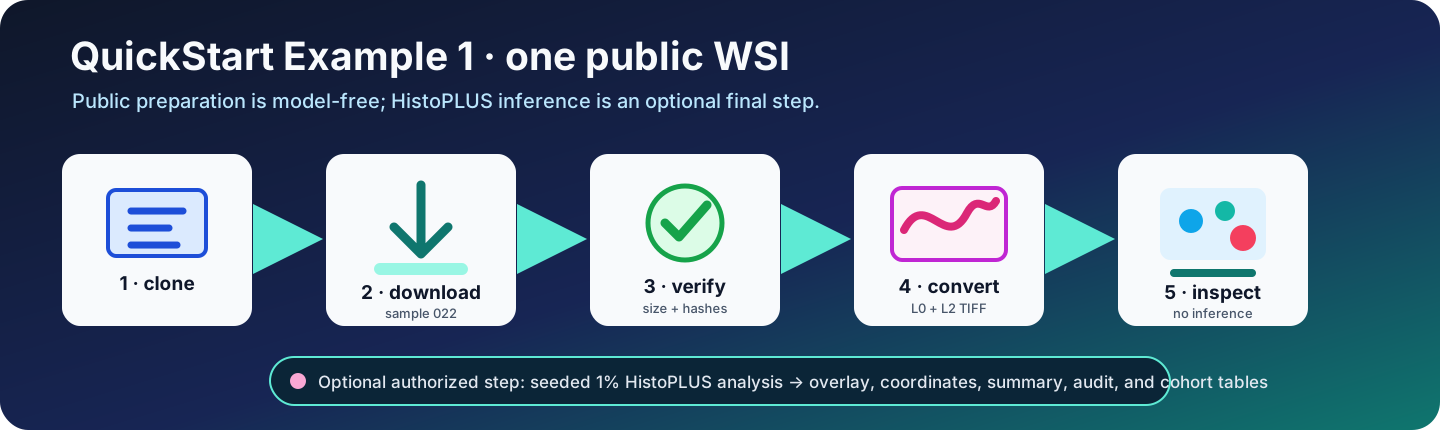
Public download, checksum validation, L0/L2 conversion, and inspection are model-free. Authorized HistoPLUS access is needed only for the optional final 1% analysis.
Full 21-slide tutorial
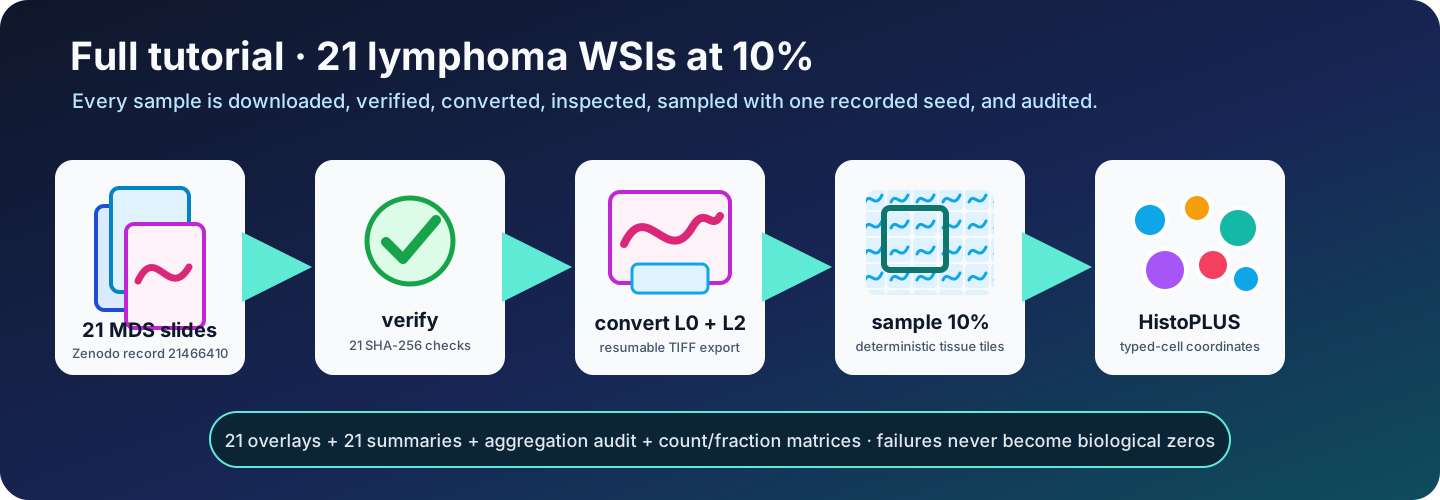
The complete public tutorial uses all 21 lymphoma WSIs with the fast preset: a deterministic 10% of detected tissue tiles per slide. Every slide must have an overlay, summary, class-count table, and audit status.
Input organization
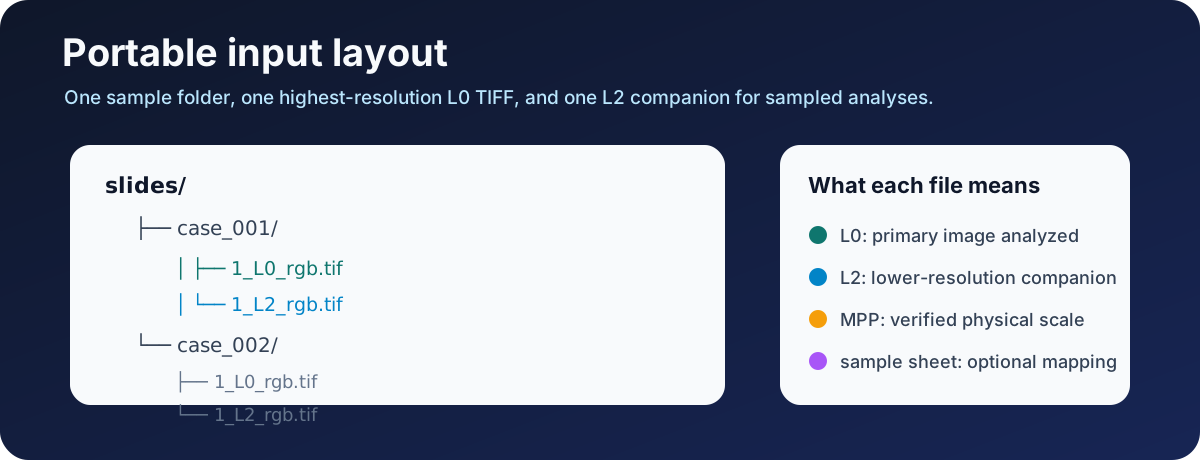
Use one L0 primary TIFF and one L2 companion per sample. The source MPP must come from scanner or export provenance.
Sampling presets
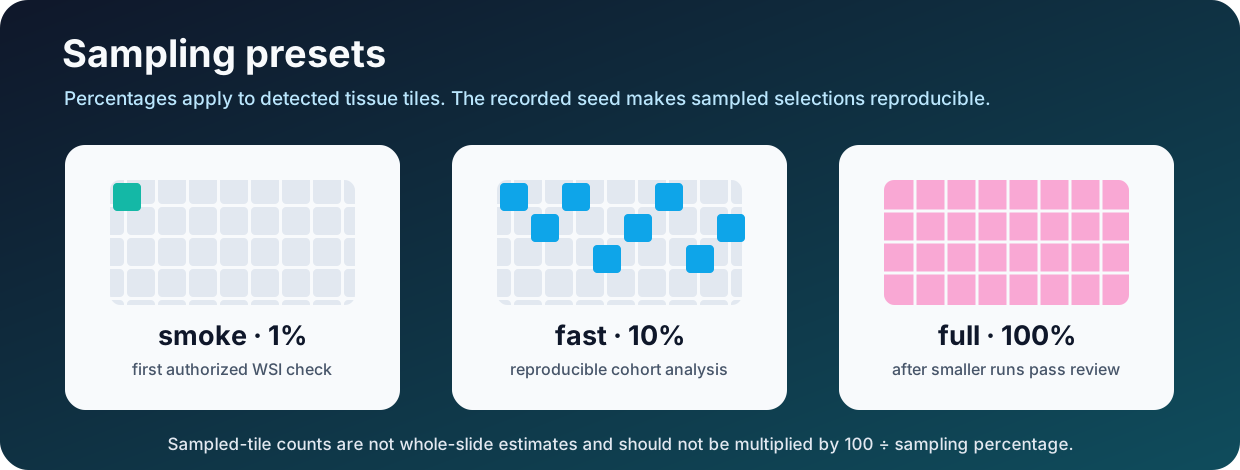
The same seed and configuration reproduce sampled tile selection. Sampled-tile counts are not whole-slide estimates.
Output review order
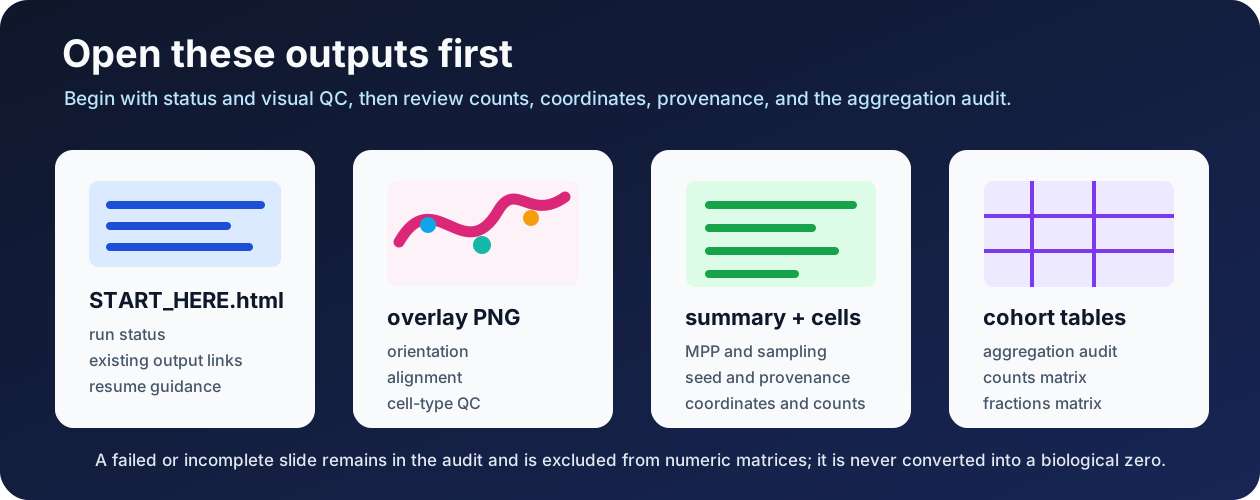
Start with START_HERE.html, review every overlay, confirm summary provenance, then inspect the aggregation audit before using count or fraction matrices.
Raw TIFF patch paper figure
┌───────────────────────────┬────────────────────────────────────┐
│ a  HistoPLUS counts + %   │ b  scale-calibrated overview      │
│    (all detected classes) ├────────────────────────────────────┤
│                           │ c  configured-overlay QC inset    │
└───────────────────────────┴────────────────────────────────────┘
celltypes_paper_figure.png and .pdf use this compact, full-width panel
organization, inspired by the visual grammar of
STTT 2026 Figure 6
and Figure 7.
Bold lowercase panel letters remain in the artwork; the sample ID and prose
move to celltypes_paper_figure_legend.txt. The QC inset uses the configured
cell-type overlay. Counts and percentages are
HistoPLUS cell-type predictions for the analyzed input, not breast-marker
scores or receptor-status calls. The layout reference imports no validation or
biological claim.
For a manuscript submission, separately review the Nature Research figure specifications; these example exports are not a journal-production compliance guarantee.
Real output filenames
A completed slide normally provides:
<sample>/
├── overlays/
│   └── celltypes_overview_and_zoom.png
├── paper_figures/
│   ├── celltypes_paper_figure.png
│   └── celltypes_paper_figure_legend.txt
├── summary/
│   └── summary.json
└── cell_types/
    ├── class_counts.csv
    └── cell_type_coordinates.csv
The completed cohort normally provides:
aggregated_celltypes/
├── sample_aggregation_audit.csv
├── celltype_counts_by_sample.csv
└── celltype_fractions_by_sample.csv
See Output files for interpretation and Research limitations before using the measurements.